Jul 22, 2024
Database Block Buffer Cache- Memory Structures

So far, we have looked at relatively small components of the SGA. Now we are going to look at one that is potentially huge in size. The block buffer cache is where Oracle stores database blocks before writing them to disk and after reading them in from disk.

This is a crucial area of the SGA for us. Make it too small and our queries will take forever to run. Make it too big and we’ll starve other processes (e.g., we won’t leave enough room for a dedicated server to create its PGA, and we won’t even get started).

We have three places to store cached blocks from individual segments in the SGA:

•\ Default pool: The location where all segment blocks are normally cached. This is the original—and, previously, the only—buffer pool.
•\ Keep pool: An alternate buffer pool where by convention you assign segments that are accessed fairly frequently, but still get aged out of the default buffer pool due to other segments needing space.
•\ Recycle pool: An alternate buffer pool where by convention you assign large segments that you access very randomly and which would therefore cause excessive buffer flushing of many blocks from many segments. There’s no benefit to caching such segments because by the time you wanted the block again, it would have been aged out of the cache. You would separate these segments out from the segments in the default and keep pools so they would not cause those blocks to age out of the cache.

Note that in the keep and recycle pool descriptions I used the phrase “by convention.” There is nothing in place to ensure that you use either the keep pool or the recycle pool in the fashion described. In fact, the three pools manage blocks in a mostly identical fashion; they do not have radically different algorithms for aging or caching blocks.

The goal here was to give the DBA the ability to segregate segments to hot, warm, and “do not care to cache” areas. The theory was that objects in the default pool would be hot enough (i.e., used enough) to warrant staying in the cache all by themselves.

The cache would keep them in memory since they were very popular blocks. If you had some segments that were fairly popular but not really hot, these would be considered the warm blocks. These segments’ blocks could get flushed from the cache to make room for blocks you used infrequently (the “do not care to cache” blocks).

To keep these warm segments’ blocks cached, you could do one of the following:

•\ Assign these segments to the keep pool, in an attempt to let the warm blocks stay in the buffer cache longer.

•\ Assign the “do not care to cache” segments to the recycle pool, keeping the recycle pool fairly small so as to let the blocks come into the cache and leave the cache rapidly (decrease the overhead of managing them all).

Having to do one of these two things increased the management work the DBA had to perform, as there were three caches to think about, size, and assign objects to. ­Remember also that there is no sharing among them, so if the keep pool has lots of unused space, it won’t give it to the overworked default or recycle pool.

All in all, these pools were generally regarded as a very fine, low-level tuning device, only to be used after most other tuning alternatives had been looked at (if I could rewrite a query to do one-tenth the I/O rather than set up multiple buffer pools, that would be my choice).

There are up to four more optional caches, the DB_nK_CACHE_SIZE, to consider in addition to the default, keep, and recycle pools. These caches were added in support of multiple block sizes in the database. A database can have a default block size, which is the size of the blocks stored in the default, keep, or recycle pool, as well as up to four nondefault block sizes, as explained in Chapter 3.

The blocks in these buffer caches are managed in the same way as the blocks in the original default pool—there are no special algorithm changes for them either. Let’s now move on to see how the blocks are managed in these pools.

More Details
May 22, 2024
PGA and UGA Wrap-Up- Memory Structures-2

The parameters that have the greatest effect on the overall size of the SGA are as follows:

•\ JAVA_POOL_SIZE: Controls the size of the Java pool.
•\ SHARED_POOL_SIZE: Controls the size of the shared pool (to some degree).
•\ LARGE_POOL_SIZE: Controls the size of the large pool.
•\ STREAMS_POOL_SIZE: Controls the size of the Streams pool.
•\ DB_*_CACHE_SIZE: Eight of these CACHE_SIZE parameters control the sizes of the various buffer caches available.
•\ LOG_BUFFER: Controls the size of the redo log buffer (to some degree).
•\ SGA_TARGET: Used with automatic SGA memory management and can be changed online.
•\ SGA_MAX_SIZE: Used to control the size of the SGA.
•\ MEMORY_TARGET: Used with automatic memory management (both PGA and SGA are automatically sized).
•\ MEMORY_MAX_SIZE: Used to control the maximum amount of memory Oracle should strive to use over both the PGA and SGA sizes under automatic memory management. This is really just a target; the PGA may exceed the optimum size if the number of users increases beyond some level or a session(s) allocates large untunable bits of memory as demonstrated earlier.
•\ INMEMORY_SIZE: Sets the size of the in-memory area in the SGA used for the in-memory column store. The default is zero which means in-­ memory is not in use.
•\ MEMOPTIMIZE_POOL_SIZE: Sets the memory size for the memoptimized rowstore feature.
•\ DB_FLASH_CACHE_SIZE: Sets the size of the flash cache used in conjunction with DB_FLASH_CACHE_FILE.

Using ASMM is simply a matter of setting the SGA_TARGET parameter to the desired SGA size, leaving out the other SGA-related parameters altogether. The database instance will take it from there, allocating memory to the various pools as needed and even taking memory away from one pool to give to another over time. This is the most common way of sizing the SGA.

When using AMM, you simply set the MEMORY_TARGET. The database instance will then decide the optimal SGA size and PGA size—and those components will be set up appropriately and do their own automatic memory management within their respective boundaries. Further, the database can and will resize the SGA and PGA allocations as the workload changes over time.

Regardless of the type of memory management you use, you’ll find that memory is allocated to the various pools in the SGA in units called granules. A single granule is an area of memory of 4MB, 8MB, or 16MB in size. The granule is the smallest unit of allocation, so if you ask for a Java pool of 5MB and your granule size is 4MB, Oracle will actually allocate 8MB to the Java pool (8 being the smallest number greater than or equal to 5 that is a multiple of the granule size of 4).

The size of a granule is determined by the size of your SGA (this sounds recursive to a degree, as the size of the SGA is dependent on the granule size). You can view the granule sizes used for each pool by querying V$SGA_DYNAMIC_COMPONENTS. In fact, we can use this view to see how the total SGA size might affect the size of the granules.

First, let’s set the SGA to a small value, and then restart the instance, and observe the granule sizes. I’ll connect to the root container of my database when running the following commands:

Note If your instance is currently running, the STARTUP FORCE command will shut down the instance (abort mode) and restart it.

Note This is the SGA information for the Oracle instance started with the initialization parameter file in the previous example. We specified the SGA and PGA sizes ourselves in that parameter file. Therefore, we are using ASMM and automatic PGA memory management, but not the AMM setting, which would have sized and resized our PGA/SGA settings for us.

In this example, I used ASMM and controlled the size of the SGA via the single parameter SGA_TARGET. When my SGA size is under about 1GB, the granule is 4MB. When the SGA size is increased to some threshold over 1GB (it will vary slightly from operating system to operating system and even from release to release), I see an increased granule size:

SQL> alter system set sga_target = 1512m scope=spfile;
SQL> startup force
SGA> show parameter sga_target

NAME TYPE VALUE

sga_target big integer 1520M
Now when we look at the SGA components:
SQL> select component, granule_size from v$sga_dynamic_components;
COMPONENT GRANULE_SIZE

As you can see, at 1.5GB of SGA, my pools will be allocated using 16MB granules, so any given pool size will be some multiple of 16MB. With this in mind, let’s look at each of the major SGA components in turn.

More Details
Jan 22, 2024
Automatic PGA Memory Management- Memory Structures

In almost all cases, you should be using automatic PGA memory management. The entire goal of automatic PGA memory management is to maximize the use of RAM while at the same time not using more RAM than you want. You can enable the automatic management of the PGA in two ways:

•\ Set MEMORY_TARGET to zero, and then set PGA_AGGREGATE_TARGET to a nonzero value. The PGA_AGGREGATE_TARGET parameter controls how much memory the instance should allocate, in total, for all work areas used to sort or hash data. Its default value varies by version and may be set by various tools such as the DBCA. In this mode, WORKAREA_SIZE_POLICY is set to AUTO (which is its default value).

•\ Use the AMM feature by setting MEMORY_TARGET to a nonzero value, and leave PGA_AGGREGATE_TARGET set to zero. This effectively lets Oracle manage the allocation of memory to the PGA. However, if you’re in a Linux environment that uses HugePages, you should not be using the AMM method to manage memory (more on this in the“System Global Area (SGA) Memory Management” section of this chapter).

The prior two techniques are discussed in the following subsections.

Setting PGA_AGGREGATE_TARGET

Most of the databases I’ve worked on in the past several years use automatic PGA memory management and automatic SGA memory management. For my test database, automatic PGA memory management and automatic SGA memory management are enabled as follows (you’ll use memory sizes appropriate for your environment, given the workload and amount of physical memory available):

$ sqlplus / as sysdba
SQL> alter system set memory_target=0 scope=spfile;
SQL> alter system set pga_aggregate_target=300M scope=spfile; SQL> alter system set sga_target=1500M scope=spfile;

Then restart the instance to instantiate the parameters (using startup force here which shuts down abort and restarts the instance):

SQL> startup force;

You don’t have to enable both PGA and SGA memory management together (as shown in the prior example). You could enable one for automatic management and leave the other for manual management. I usually don’t implement it that way, but you can do it.

Also, some places I’ve worked have set the PGA_AGGREGATE_LIMIT parameter as well. In most scenarios, you don’t need to set this parameter as it will default to a reasonable value. If for some reason you need more control, then feel free to set it. Keep in mind if you set this parameter too low, you’ll get an ORA-00093 error, and your instance will fail to start. In this situation, you’ll need to create a text-based init.ora file, and restart your instance, and re-create your spfile (see Chapter 3 for details on how to do this).

Setting MEMORY_TARGET

The automatic memory management of the PGA is enabled as follows (adjust the memory sizes per your environment):

$ sqlplus / as sysdba
SQL> alter system set memory_target=1500M scope=spfile;
SQL> alter system set pga_aggregate_target=0 scope=spfile;
SQL> alter system set sga_target=0 scope=spfile;

And at this point, you can restart your instance to instantiate the parameters. If you want to give Oracle recommendations on minimal values to use for the SGA_TARGET and PGA_AGGREGATE_TARGET, you can set these to a nonzero value (as long as the sum of these is less than the value of MEMORY_TARGET):

SQL> alter system set sga_target=500M scope=spfile;
SQL> alter system set pga_aggregate_target=400M scope=spfile;

Note This PGA_AGGREGATE_TARGET parameter is optional for pluggable databases. When this parameter is set in a pluggable database, it specifies the target aggregate PGA size for the pluggable database.

Now that we’ve covered enabling automatic PGA memory management, let’s next look at how the PGA memory is allocated.

More Details
Sep 22, 2023
Flat Files- Files

Flat files have been around since the dawn of electronic data processing. We see them literally every day. The text alert log described previously is a flat file. I found the following definition for “flat file” on the Internet and feel it pretty much wraps things up:

An electronic record that is stripped of all specific application (program) formats. This allows the data elements to be migrated into other applica-tions for manipulation. This mode of stripping electronic data prevents data loss due to hardware and proprietary software obsolescence.

A flat file is simply a file whereby each “line” is a “record,” and each line has some text delimited, typically by a comma or pipe (vertical bar). Flat files are easily read by Oracle using either the legacy data loading tool SQLLDR or external tables. In fact, I will cover this in detail in Chapter 15.

Occasionally, a user will request data in a flat file format such as one of the following:

•\ Character (or comma) separated values (CSV): These are easily imported into tools such as spreadsheets.
•\ HyperText Markup Language (HTML): Used to display pages displayed in web browsers.
•\ JavaScript Object Notation (JSON): Standard text-based format for representing structured data and used for transmitting data in web browsers.

I’ll briefly demonstrate generating each of the file types in the following sections.

Generating a CSV File

You can easily generate CSV flat files from SQLPlus. You can either use the -m ‘csv on’ switch from the operating system prompt or use SET MARKUP CSV after starting a SQLPlus session, for example:

$ sqlplus scott/tiger@PDB1
SQL> set markup csv on delimiter , quote off SQL> SELECT * FROM dept;DEPTNO,DNAME,LOC

10,ACCOUNTING,NEW YORK

20,RESEARCH,DALLAS

30,SALES,CHICAGO

40,OPERATIONS,BOSTON

Here is an example of using the -m ‘csv on’ switch at the command line:

$ sqlplus -markup ‘csv on quote off’ scott/tiger@PDB1
SQL> select * from emp where rownum < 3;

EMPNO,ENAME,JOB,MGR,HIREDATE,SAL,COMM,DEPTNO 7369,SMITH,CLERK,7902,17-DEC-80,800,,20 7499,ALLEN,SALESMAN,7698,20-FEB-81,1600,300,30

Tip When you use the -markup ‘csv on’ switch, SQL*Plus sets variables such as ROWPREFETCH, STATEMENTCACHE, and PAGESIZE to optimize I/O performance.

Generating HTML

Similar to generating a CSV file, you can generate an HTML file from SQL*Plus by setting

SET MARKUP HTML ON before running your query:

SQL> set markup html on
SQL> select * from dept;

DEPTNODNAME… You can also specify the -markup ‘html on’ switch at the command line to generate HTML output: $ sqlplus -markup ‘html on’ scott/tiger@PDB1 In this manner, you can easily produce HTML output based on the contents of a table.
More Details
Jun 22, 2023
Tablespaces- Files

As noted earlier, a tablespace is a container—it holds segments. Each segment belongs to exactly one tablespace. A tablespace may have many segments within it. All of the extents for a given segment will be found in the tablespace associated with that segment. Segments never cross tablespace boundaries.

A tablespace itself has one or more datafiles associated with it. An extent for any given segment in a tablespace will be contained entirely within one datafile. However, a segment may have extents from many different datafiles.

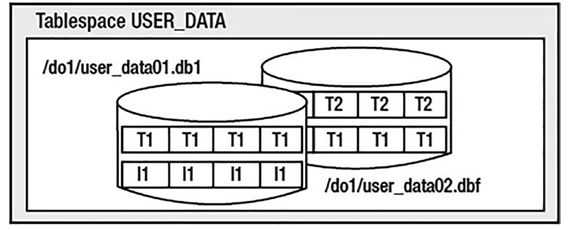
Graphically, a tablespace might look like Figure 3-3.

Figure 3-3.  A tablespace containing two datafiles, three segments, and four extents

Figure 3-3 shows a tablespace named USER_DATA. It consists of two datafiles, user_data01.dbf and user_data02.dbf. It has three segments allocated to it: T1, T2, and I1 (probably two tables and an index).

The tablespace has four extents allocated in it, and each extent is depicted as a logically contiguous set of database blocks. Segment T1 consists of two extents, one extent in each file. Segments T2 and I1 each have one extent depicted. If we need more space in this tablespace, we could either resize the datafiles already allocated to the tablespace or we could add a third datafile to it.

A tablespace is a logical storage container in Oracle. As developers, we will create segments in tablespaces. We will never get down to the raw file level—we don’t specify that we want our extents to be allocated in a specific file (we can, but in general we don’t). Rather, we create objects in tablespaces and Oracle takes care of the rest. If at some point in the future, the DBA decides to move our datafiles around on disk to more evenly distribute I/O, that is OK with us. It will not affect our processing at all.

Storage Hierarchy Summary

In summary, the hierarchy of storage in Oracle is as follows:

\ 1.\ A database is made up of one or more tablespaces.

\ 2.\ A tablespace is made up of one or more datafiles. These files might be cooked files in a file system, raw partitions, ASM-managed database files, or a file on a clustered file system. A tablespace contains segments.

\ 3.\ A segment (TABLE, INDEX, and so on) is made up of one or more extents. A segment exists in a tablespace, but may have data in many datafiles within that tablespace.

\ 4.\ An extent is a logically contiguous set of blocks on disk. An extent is in a single tablespace and, furthermore, is always in a single file within that tablespace.

\ 5.\ A block is the smallest unit of allocation in the database. A block is the smallest unit of I/O used by a database on datafiles.

More Details
Sep 22, 2022
Online Redo Log- Files-2

So, when this message appeared, processing was suspended in the database while DBWn hurriedly finished its checkpoint. Oracle gave all the processing power it could to DBWn at that point in the hope it would finish faster.

This is a message you never want to see in a nicely tuned database instance. If you do see it, you know for a fact that you have introduced artificial, unnecessary waits for your end users. This can always be avoided. The goal (and this is for the DBA, not the developer necessarily) is to have enough online redo log files allocated so that you never attempt to reuse a log file before the checkpoint (initiated by the log switch) completes. If you see this message frequently, it means a DBA has not allocated sufficient online redo logs for the application, or that DBWn needs to be tuned to work more efficiently.

Different applications will generate different amounts of redo log. A decision support system (DSS, query only) or DW system will naturally generate significantly less online redo logging than an OLTP (transaction processing) system would, day to day. A system that does a lot of image manipulation in Binary Large Objects (BLOBs) in the database may generate radically more redo than a simple order entry system. An order entry system with 100 users will probably generate a tenth the amount of redo 1000 users would generate. Thus, there is no “right” size for your redo logs, although you do want to ensure they are large enough for your unique workload.

You must take many things into consideration when setting both the size of and the number of online redo logs. Many of them are beyond the scope of this book, but I’ll list some of them to give you an idea:

•\ Peak workloads: You’d like your system to not have to wait for checkpoint-not-complete messages, to not get bottlenecked during your peak processing. You should size your redo logs not for average hourly throughput, but rather for your peak processing. If you generate 24GB of log per day, but 10GB of that log is generated between 9:00 am and 11:00 am, you’ll want to size your redo logs large enough to carry you through that two-hour peak. Sizing them for an average of 1GB per hour would probably not be sufficient.

•\ Lots of users modifying the same blocks: Here, you might want large redo log files. Since everyone is modifying the same blocks, you’d like to update them as many times as possible before writing them out to disk. Each log switch will fire a checkpoint, so you’d like to switch logs infrequently. This may, however, affect your recovery time.

•\ Mean time to recover: If you must ensure that a recovery takes as little time as possible, you may be swayed toward smaller redo log files, even if the previous point is true. It will take less time to process one or two small redo log files than a gargantuan one upon recovery. The overall system will run slower than it absolutely could day to day perhaps (due to excessive checkpointing), but the amount of time spent in recovery will be shorter. There are other database parameters that may also be used to reduce this recovery time, as an alternative to the use of small redo log files.

More Details
Aug 22, 2022
Archived Redo Log- Files

The Oracle database can run in one of two modes: ARCHIVELOG mode and NOARCHIVELOG mode. The difference between these two modes is simply what happens to a redo log file when Oracle goes to reuse it. “Will we keep a copy of that redo or should Oracle just overwrite it, losing it forever?” is an important question to answer. Unless you keep this file, you can’t recover data from a backup to that point in time.

Say you take a backup once a week on Saturday. Now, on Friday afternoon, after you have generated hundreds of redo logs over the week, your hard disk fails. If you have not been running in ARCHIVELOG mode, the only choices you have right now are as follows:

•\ Drop the tablespace(s) associated with the failed disk. Any tablespace that had a file on that disk must be dropped, including the contents of that tablespace. If the SYSTEM tablespace (Oracle’s data dictionary) or some other important system-related tablespace like your UNDO tablespace is affected, you can’t do this. You will have to use the next option instead.

•\ Restore last Saturday’s data and lose all of the work you did that week.

Neither option is very appealing. Both imply that you lose data. If you had been executing in ARCHIVELOG mode, on the other hand, you simply would have found another disk and restored the affected files from Saturday’s backup onto it. Then, you would have applied the archived redo logs and, ultimately, the online redo logs to them (in effect replaying the week’s worth of transactions in fast-forward mode). You lose nothing. The data is restored to the point of the failure.

People frequently tell me they don’t need ARCHIVELOG mode for their production systems. I have yet to meet anyone who was correct in that statement. I believe that a system is not a production system unless it is in ARCHIVELOG mode. A database that is not in ARCHIVELOG mode will, someday, lose data. It is inevitable; you will lose data (not might, but will) if your database is not in ARCHIVELOG mode.

“We are using RAID-5, so we are totally protected” is a common excuse. I’ve seen cases where, due to a manufacturing error, all disks in a RAID set froze, all at about the same time. I’ve seen cases where the hardware controller introduced corruption into the datafiles, so people safely protected corrupt data with their RAID devices. RAID also does not do anything to protect you from operator error, one of the most common causes of data loss. RAID does not mean the data is safe, it might be more available, it might be safer, but data solely on a RAID device will be lost someday; it is a matter of time.

“If we had the backups from before the hardware or operator error and the archives were not affected, we could have recovered.” The bottom line is that there is no excuse for not being in ARCHIVELOG mode on a system where the data is of any value. Performance is no excuse; properly configured archiving adds little to no overhead. This, and the fact that a fast system that loses data is useless, means that even if archiving added 100 percent overhead, you still need to do it. A feature is overhead if you can remove it and lose nothing important; overhead is like icing on the cake. Preserving your data and making sure you don’t lose your data isn’t overhead—it’s the DBA’s primary job!

Only a test or maybe a development system should execute in NOARCHIVELOG mode. Most development systems should be run in ARCHIVELOG mode for two reasons:

•\ This is how you will process the data in production; you want development to act and react as your production system would.
•\ In many cases, the developers pull their code out of the data dictionary, modify it, and compile it back into the database. The development database holds the current version of the code. If the development database suffers a disk failure in the afternoon, what happens to all of the code you compiled and recompiled all morning? It’s lost.

Don’t let anyone talk you out of being in ARCHIVELOG mode. You spent a long time developing your application, so you want people to trust it. Losing their data will not instill confidence in your system.

Note There are some cases in which a large DW could justify being in NOARCHIVELOG mode—if it made judicious use of READ ONLY tablespaces and was willing to fully rebuild any READ WRITE tablespace that suffered a failure by reloading the data.

More Details
Jun 22, 2022
The Storage Hierarchy in an Oracle Database- Files-2

The relationship between segments, extents, and blocks is shown in Figure 3-1.

Figure 3-1.  Segments, extents, and blocks

A segment is made up of one or more extents, and an extent is a logically contiguous allocation of blocks. A database may have up to six different block sizes in it.

Note  This feature of multiple block sizes was introduced for the purpose of making transportable tablespaces usable in more cases. The ability to transport a tablespace allows a DBA to move or copy the already formatted datafiles from one database and attach them to another—for example, to immediately copy all of the tables and indexes from an Online Transaction Processing (OLTP) database to a data warehouse (DW). However, in many cases, the OLTP database might be using a small block size, such as 2KB or 4KB, whereas the DW would be using a much larger one (8KB or 16KB). Without support for multiple block sizes in a single database, you wouldn’t be able to transport this information. Tablespaces with multiple block sizes should be used to facilitate transporting tablespaces; they are not generally used for anything else.

There will be the database default block size, which is the size specified in the initialization file during the CREATE DATABASE command. The SYSTEM tablespace will have this default block size always, but you can then create other tablespaces with nondefault block sizes of 2KB, 4KB, 8KB, 16KB, and, depending on the operating system, 32KB. The total number of block sizes is six if and only if you specified a nonstandard block size (not a power of two) during database creation. Hence, for all practical purposes, a database will have at most five block sizes: the default size and then four other nondefault sizes.

Any given tablespace will have a consistent block size, meaning that every block in that tablespace will be the same size. A multisegment object, such as a table with a LOB column, may have each segment in a tablespace with a different block size, but any given segment (which is contained in a tablespace) will consist of blocks of exactly the same size.

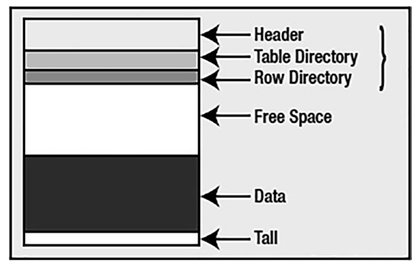
Most blocks, regardless of their size, have the same general format, which looks something like Figure 3-2.

Figure 3-2.  The structure of a block

Exceptions to this format include LOB segment blocks and hybrid columnar compressed blocks in Exadata storage, for example, but the vast majority of blocks in your database will resemble the format in Figure 3-2. The block header contains information about the type of block (table block, index block, and so on), transaction information when relevant (only blocks that are transaction managed have this information—a temporary sort block would not, for example) regarding active and past transactions on the block, and the address (location) of the block on the disk.

The next two block components are found on the most common types of database blocks, those of heap-organized tables. We’ll cover database table types in much more detail in Chapter 10, but suffice it to say that most tables are of this type.

The table directory, if present, contains information about the tables that store rows in this block (data from more than one table may be stored on the same block). The row directory contains information describing the rows that are to be found on the block.

This is an array of pointers to where the rows are to be found in the data portion of the block. These three pieces of the block are collectively known as the block overhead, which is space used on the block that is not available for your data, but rather is used by Oracle to manage the block itself.

The remaining two pieces of the block are straightforward: there may be free space on a block, and then there will generally be used space that is currently storing data.

Now that you have a cursory understanding of segments, which consist of extents, which consist of blocks, let’s take a closer look at tablespaces and then at exactly how files fit into the big picture.

More Details
May 22, 2022
Datafiles- Files

Datafiles, along with redo log files, are the most important type of files in the database. This is where all of your data will ultimately be stored. Every database has at least one datafile associated with it and typically has many more than one.

You can view the datafiles for your database by querying the data dictionary. The names of the datafiles will vary depending on whether you’re using RAC (with datafiles on ASM disk) and/ or Oracle Managed Files (OMF).

For example, here are the datafiles in a RAC container database, using ASM disks, and the OMF naming convention:

SQL> select name from v$datafile;

NAME
+DATA/CDB/DATAFILE/system.257.1064287113
+DATA/CDB/DATAFILE/sysaux.258.1064287137
+DATA/CDB/DATAFILE/undotbs1.259.1064287153

+DATA/CDB/86B637B62FE07A65E053F706E80A27CA/DATAFILE/system.265.1064287787
+DATA/CDB/86B637B62FE07A65E053F706E80A27CA/DATAFILE/sysaux.266.1064287787
+DATA/CDB/DATAFILE/users.260.1064287153
+DATA/CDB/86B637B62FE07A65E053F706E80A27CA/DATAFILE/undotbs1.267.1064287787
+DATA/CDB/DATAFILE/undotbs2.269.1064288035
+DATA/CDB/BB1C6AAC137C6A4DE0536638A8C06678/DATAFILE/system.274.1064288517
+DATA/CDB/BB1C6AAC137C6A4DE0536638A8C06678/DATAFILE/sysaux.275.1064288517

The prior output shows three SYSTEM datafiles (where the Oracle data dictionary is stored). One is for the root container database, and the other two are associated with pluggable databases.

The long random string in the directory path is the GUID (unique identifier) associated with the pluggable databases when using OMF files.

Listed next are the datafiles in a single instance container database (not using OMF):

SQL> select name from v$datafile;

NAME

/opt/oracle/oradata/CDB/system01.dbf
/opt/oracle/oradata/CDB/sysaux01.dbf
/opt/oracle/oradata/CDB/undotbs01.dbf
/opt/oracle/oradata/CDB/pdbseed/system01.dbf
/opt/oracle/oradata/CDB/pdbseed/sysaux01.dbf
/opt/oracle/oradata/CDB/users01.dbf /opt/oracle
/oradata/CDB/pdbseed/undotbs01.dbf /opt/oracle
/oradata/CDB/PDB1/system01.dbf
/opt/oracle/oradata/CDB/PDB1/sysaux01.dbf
/opt/oracle/oradata/CDB/PDB1/undotbs01.dbf
/opt/oracle/oradata/CDB/PDB1/users01.dbf
/opt/oracle/oradata/CDB/PDB2/system01.dbf
/opt/oracle/oradata/CDB/PDB2/sysaux01.dbf
/opt/oracle/oradata/CDB/PDB2/undotbs01.dbf
/opt/oracle/oradata/CDB/PDB2/users01.db

The datafiles in this directory /opt/oracle/oradata/CDB belong to the root container.
The datafiles in subdirectories belong to pluggable databases. Each database will usually (minimally) have the following datafiles:

•\ SYSTEM: Stores the Oracle data dictionary
•\ SYSAUX: Contains other non-dictionary objects
•\ UNDO: Stores the undo segments used for rollback operations
•\ USERS: A default tablespace to be used for application data (if no other tablespace is designated)

After a brief review of file system types, we’ll discuss how Oracle organizes these files and how data is organized within them. To understand this, you need to know what tablespaces, segments, extents, and blocks are. These are the units of allocation that Oracle uses to hold objects in the database, and I describe them in detail shortly.

More Details
Apr 22, 2022
Tagging Trace Files- Files-2

PROBLEM_ID PROBLEM_KEY

LAST_INCIDENT LASTINC_TIME

There was recently an ORA-700 error in my database. I can now see what was affected by that error by issuing the show incident command:

adrci> show incident

INCIDENT_ID PROBLEM_KEY CREATE_TIME
———— ————————— ————————-
1 ORA 700 [pga physmem limit] 021-01-24 19:33:31.863000 +00:00
2402 ORA 700 [pga physmem limit] 021-01-24 19:34:50.006000 +00:00
4803 ORA 700 [pga physmem limit] 021-01-24 19:35:20.619000 +00:00
7204 ORA 700 [pga physmem limit] 021-01-24 19:42:03.463000 +00:00
9605 ORA 700 [pga physmem limit] 021-01-24 19:49:46.391000 +00:00

I can see there are several incidents, and I can identify the information related to each incident via the show tracefile command:

adrci> show tracefile -I 2402
diag/rdbms/cdb/CDB/incident/incdir_2402/CDB_ora_5317_i2402.trc

This shows me the location of the trace file for the incident number listed. Further, I can see a lot of detail about the incident if I so choose:

adrci> show incident -mode detail -p “incident_id=2402”
ADR Home = /opt/oracle/diag/rdbms/cdb/CDB:

INCIDENT INFO RECORD 1

INCIDENT_ID 2402

STATUS ready

PROBLEM_ID 1

CLOSE_TIME

FLOOD_CONTROLLED none

ERROR_FACILITY ORA

ERROR_NUMBER 700

ERROR_ARG1 pga physmem limit

And, finally, I can create a “package” of the incident that is useful for support. The package will contain everything a support analyst needs to begin working on the problem.

This section is not intended to be a full overview or introduction to the ADRCI utility, which is documented fully in the Oracle Database Utilities manual. Rather, I just wanted to introduce the existence of the tool—a tool that makes using trace files easy.

The database information is important to have when you go to http://support. oracle.com to file the service request or to search to see if what you are experiencing is a known problem. In addition, you can see the Oracle instance on which the error occurred. It is quite common to have many instances running concurrently, so isolating the problem to a single instance is useful.

Here’s another section of the trace file to be aware of:

*** SESSION ID:(266.55448) 2021-02-15T15:39:09.939349+00:00
*** CLIENT ID:() 2021-02-15T15:39:09.939354+00:00
*** SERVICE NAME:(SYS$USERS) 2021-02-15T15:39:09.939358+00:00
*** MODULE NAME:(sqlplus@localhost (TNS V1-V3)) 2021-02-­ 15T15:39:09.939364+00:00
*** ACTION NAME:() 2021-02-15T15:39:09.939368+00:00
*** CLIENT DRIVER:(SQL*PLUS) 2021-02-15T15:39:09.939372+00:00
*** CONTAINER ID:(1) 2021-02-15T15:39:09.939376+00:00

This part of the trace file shows the session information available in the columns ACTION and MODULE from V$SESSION. Here, we can see that it was a SQL*Plus session that caused the error to be raised (you and your developers can and should set the ACTION and MODULE information; some environments such as Oracle Forms and APEX already do this for you).

Additionally, we have the SERVICE NAME. This is the actual service name used to connect to the database—SYS$USERS, in this case—indicating we didn’t connect via a TNS service. If we logged in using user/pass@CDB, we might see

*** SERVICE NAME:(CDB) 2021-02-15T15:55:42.704845+00:00

Here, CDB is the service name (not the TNS connect string; rather, it’s the ultimate service registered in a TNS listener to which it connected). This is also useful in tracking down which process or module is affected by this error.

Lastly, before we get to the actual error, we can see the session ID (266 in this example), session serial number (55448 in this example), and related date/time information (all releases) as further identifying information:

*** SESSION ID:(266.55448) 2021-02-15T15:39:09.939349+00:00

From here, you can dig further into the trace file and try to determine what is causing the problem. The other important pieces of information are the error code (typically 600, 3113, or 7445) and other arguments associated with the error code. Using these, along with some of the stack trace information that shows the set of Oracle internal subroutines that were called in order, we might be able to find an existing bug (and workarounds, patches, and so on).

Typically, you’ll do a Google search of any relevant error messages. If you don’t readily find an answer, you can create a service request with Oracle Support and attach the trace files to the request. Oracle Support can help you identify if you’ve hit a bug or provide options on workarounds.

More Details